INDIAN INDICES
NIFTY and Bank nifty ended in red whereas Midcap and smallcap closed in green gaining 1.74% and 2.02%.
NIFTY SUPPORT & RESISTANCE
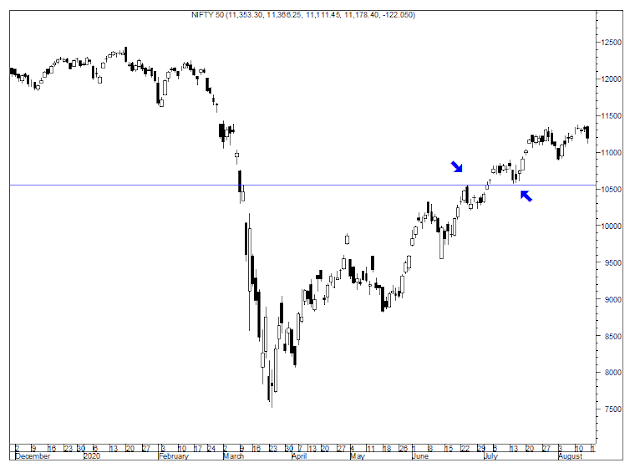
NIFTY is currently at trend line resistance and it has engulfed entire week's trading range which is bearish. However nifty is still making higher top and higher low and not broken previous swing low around 10800 and closed near 20 DEMA.
Price action made higher high on daily chart where as RSI indicator did not make a new high suggesting loss of momentum & correction towards 10800-10500 cannot be ruled out.
NIFTY has got very strong support between 10800 and 10500. It is the zone where we have 200 DEMA and 50 DEMA.
Further the Fibonacci retracement of 61.8% is at 10500.
NIFTY has got multiple support between 10800 and 10500. All quality stocks need to be added between this zone. RSI indicator is indicating loss of momentum and after such huge rally correction is due.
P.S - Follow on twitter @amolshetke


Comments
Post a Comment
If you have any queries please contact me