Monthly chart of Nifty showing long wicks for last 3 months

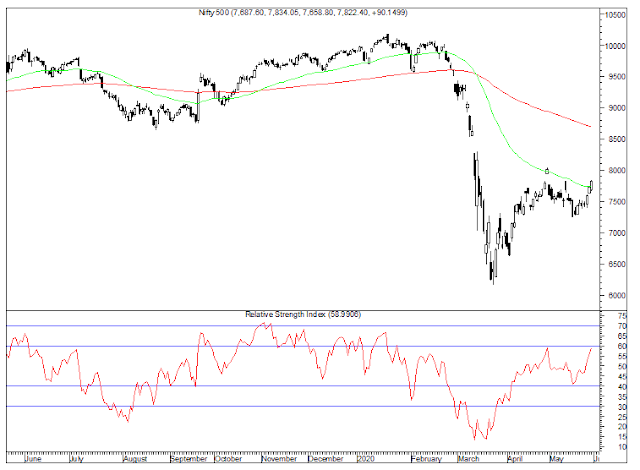
NIFTY 500 -
Nifty 500 is trading above 50 DMA, indicating broader market participation.
NIFTY AUTO INDEX -
Nifty Auto Index is trading above 50 DMA and previous swing high. RSI is above 60 which is indicating bullish trend.

NIFTY BANK -
Positive divergence seen between price and RSI. Double bottom visible on chart.

NIFTY COMMODITIES -
Nifty commodities is trading above 50 DMA and previous swing high. RSI is above 60 which is indicating bullish trend.

NIFTY PHARMA -
Nifty Pharma - WEEKLY - BO from downtrend line, Range shift in RSI, consolidating above BO

NIFTY CONSUMPTION-
Nifty Consumption - RSI above 60 and price trading above previous swing high.

NIFTY ENERGY-
Nifty Energy - On weekly chart heading into resistance.


NIFTY IT-
Nifty IT - Ready for BO from consolidation?

NIFTY COMMODITIES-
Nifty Commodities - RSI above 60 and trading above previous swing high.

NIFTY METAL -
Nifty Metal - RSI above 60 and trading above 50 DMA.

P.S - Please comment if something needs to be added, will add in next future charts.
Comments
Post a Comment
If you have any queries please contact me